SpreadPlots
SpreadPlots
help you explore your data (and models of the data)
to see what they seem to say.
SpreadPlots
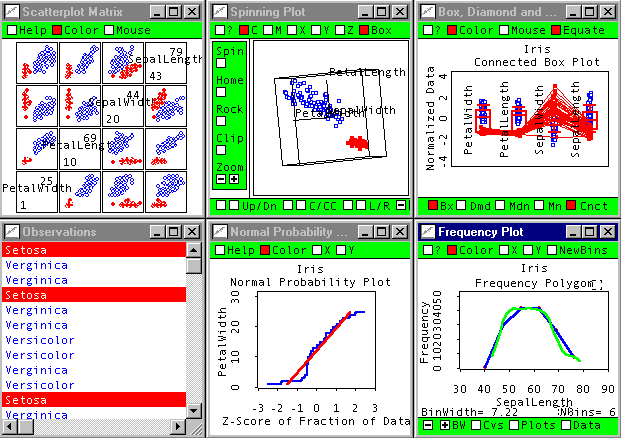
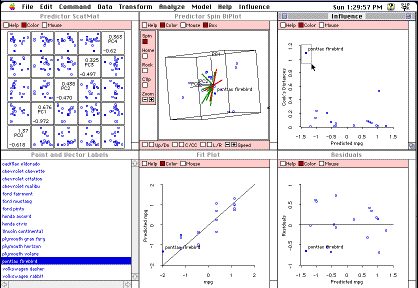
are state of the art: They are structured, multi-window,
linked, dynamic and interactive.
- Multi-Window: SpreadPlots are groups of several
plot-windows.
- Structured: Each plot-window show a particular
aspect of your data or model.
- Linked: The plot-windows can be linked by
the data's observations or variables.
- Dynamic: Each plot window shows a dynamic
graphic. For example, spinplots spin to communicate
3D structure. Boxplots can show a moving parallel
coordinate plot to communicate higher dimensional
structure.
- Interactive: You interact with the spinplot
to make it spin, with the boxplot to move the parallel
coordinate lines.
Here are three of the many spreadplots available in
ViSta.
Spreadplot for Two Way Classification of Singer's
Heights

|
|
Spreadplot for Multivariate Data

|
| |
Spreadplot for Regression Model
(Click for full-size image)

|
|
|