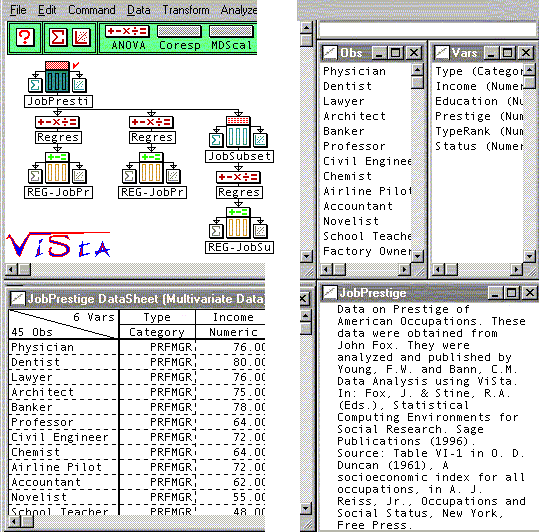
The
Structured Desktop
ViSta's
Desktop has WorkMaps, GuideMaps, SpreadPlots, Datasheets
and other features designed to structure and assist
the statistical analyst.
Here is
an example of a ViSta desktop (a portion has been snipped
away to fit the web page):

ViSta's Structured
Desktop has:
-
WorkMaps
that visually summarize your data analysis session.
In the WorkMap shown on the left, the analyst has
loaded in a dataset (JobPrestige), has performed
two regression analyses on the dataset, has obtained
a new data object from the original one (JobSubset)
which has served as the basis for a third regression
analysis.
-
DataSheets
that display the data and support data editing and
entry.
-
Text
windows that show statistics, variable and observation
names, help, etc.
|
|