-
Two-Way ANOVA is used in research situations in which there
are two independent (classification) variables - two-factor
experiments, in the Gravetter and Wallnau terminology.
-
Example
- An experiment is designed to investigate change in systolic
blood pressure after administering one of four different
drugs to patients with one of three different blood diseases.
These data are from Afifi and Azen (1972), and are cited
in Kutnet (1974). They are used as an example of 2-way ANOVA
in SAS, BMDP and SYSTAT. You can download the ViSta
Data. You can also download the Eysenck
Data
In these data:
- the independent (classification) variables are drug
and disease.
- the dependent (response) variable is systolic blood
pressure.
This is a two-way experiment whose design is called a "three-by-four
factorial design".
Here are the data:
| Systolic Blood Pressure |
| . |
Disease A |
Disease B |
Disease C |
| Drug 1 |
42 44 36 13 19 22 |
33 26 33 21 |
31 -3 25 25 24 |
| Drug 2 |
28 23 34 42 13 |
34 33 31 36 |
3 26 28 32 4 16 |
| Drug 3 |
1 29 19 |
11 9 7 1 -6 |
21 1 9 3 |
| Drug 4 |
24 9 22 -2 15 |
27 12 12 -5 16 15 |
22 7 25 5 12 |
For ViSta these data are entered as a multivariate matrix
with three variables: One of the variables is the response
(dependent) variable, which is change in blood pressure.
The other two variables are the classification (independent)
variables, Drug and Disease.
Here is how the first few values would be entered:
| Pressure |
Drug |
Disease |
| Numeric |
Category |
Category |
| 42 |
Drug1 |
DiseaseA |
| 44 |
Drug1 |
DiseaseA |
| 36 |
Drug1 |
DiseaseA |
| 13 |
Drug1 |
DiseaseA |
| 19 |
Drug1 |
DiseaseA |
| 22 |
Drug1 |
DiseaseA |
| 33 |
Drug1 |
DiseaseB |
| 26 |
Drug1 |
DiseaseB |
| 33 |
Drug1 |
DiseaseB |
| ...continued... |
-
Factorial Design
- Definition: An experimental design in which every
level of every way of the design is paired with every level
of every other way of the design is called a Factorial
Design. Such a design includes all combinations of the
levels of the independent variables.
- Factors: The ways of the design are often called
factors.
- Levels: A specific value of a factor.
- Cells: A cell of a factorial design is a specific
combination of a particular level of each factor of
the design.
- Advantages: Factorial designs have several important
advantages over one-way designs.
- Generalizability:
They allow greater generalizability of results. If we
only ran the blood pressure study with one disease we
wouldn't know whether the results applied to other diseases.
Doing the study with three diseases allows us to generalize
across at least some diseases.
- Interaction:
They allow us to look at interaction of the variables.
We can ask whether the effect of the drugs is independent
of the disease (i.e., is the same for the diseases)
or whether there is an interaction (i.e., they work
differently for different diseases). In two-way designs
we can look at two-way interactions.
- Economy:
We can have fewer subjects and still have a powerful
experiment, since we can look at the effect of one factor
(Drug or Disease) averaged over the levels of the other
factor.
- N-Way Factorial Designs.
We can have more than just two ways of the design. For example,
the drug study could be performed at two different hospitals,
making for a 3x4x2 factorial design.
- In three-way designs we can look at every pair of
two-way interactions as well as the three-way interaction,
an advantage.
- In higher-way designs we can look at very many interaction
terms, but they become hard to understand.
- ViSta can only look at two-way interactions.
- Balanced/Unbalanced Factorial Designs.
A balanced factorial design is one that has the same
number of observations in every cell. Unbalanced designs
do not have the same number. The data above are unbalanced.
- The calculations for unbalanced designs are more complex
and the interpretation can be very unclear.
- It is best to avoid these unbalanced data, but in
survey research such analyses are common.
- ViSta can analyze them.
- Complete/Incomplete Factorial Designs.
A complete factorial design is one for which every cell
has some data.
- Incomplete designs, in which some cells have missing
data, are very difficult to analyze, and are difficult
to interpret.
- These designs should be avoided.
- ViSta cannot analyze incomplete data.
Analysis Results
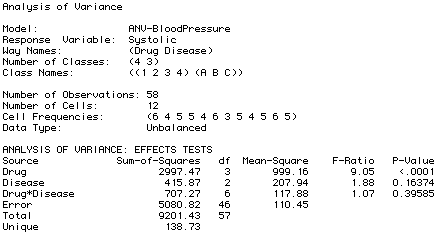
Here is the report produced by ViSta's analysis of the blood-preasure
data:

|
-
Hypotheses
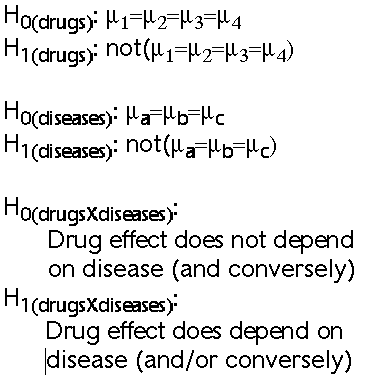
- The two-way ANOVA for a factorial design provides three
separate hypothesis tests in one analysis. These hypothese
are like those in one-way ANOVA. They are non-directional.

-
F-Tests
- Each F-test is based on its own F-Ratio. Each F-Ratio
has the same basic structure given for one-way ANOVA
(variance of the sample means divided by error variance):

- Each F-Ratio is evaluated for significance in just
the same way we saw for one-way ANOVA.
-
Systolic Blood Pressure Example
- For our example two-way ANOVA allows the researcher to
construct F-Tests that reveal:
- the significance of the differences between the four
drugs
- the significance of the differences between the three
diseases
- the significance of any other differences that may
result from unique combinations of a specific drug and
a specific disease (for example, drug 1 may be particularly
effective with disease B).
- Main Effects:
- The mean differences among the levels of one factor
are called the main effects. In our example we
have two main effects: The Drug effect and the Disease
effect.
In our example the design of the research study is
represented as a table. The Drug factor determines
the rows and the Disease factor the columns. The differences
among the row means describes the main effect for
the Drug factor. Similarly, the differences among
the column means describes the main effect for the
Disease factor.
Note that the differences among the means describes
the main effects. These differences are the basis
of the F-test. It tests whether the differences are
statistically significant.
There is a seperate set of hypothesis for each main
effect, and a separate F-test for each main effect.
Each test has it's own p-level.
- Interactions:
- In addition to evaluating the significance of the
differences in means for each main effect, two-way ANOVA
allows you to evaluate differences in means that may
result from unique combinations of the two main factors.
There is an interaction between two factors
if the effect of one factor depends on the levels
of the other factor.
There is a seperate hypothesis for the interaction
effect, and a separate F-test for the interaction
effect. The test has it's own p-level.
For this example we conclude
- There is a significant effect for Drugs: They
do not all have the same effect on the patients,
regardless of disease. The effect of the drug depends
on the patient's disease.
- There is no effect for Diseases: The drugs have
the same effects on patients regardless of their
disease.
- There is no significant interaction effect.
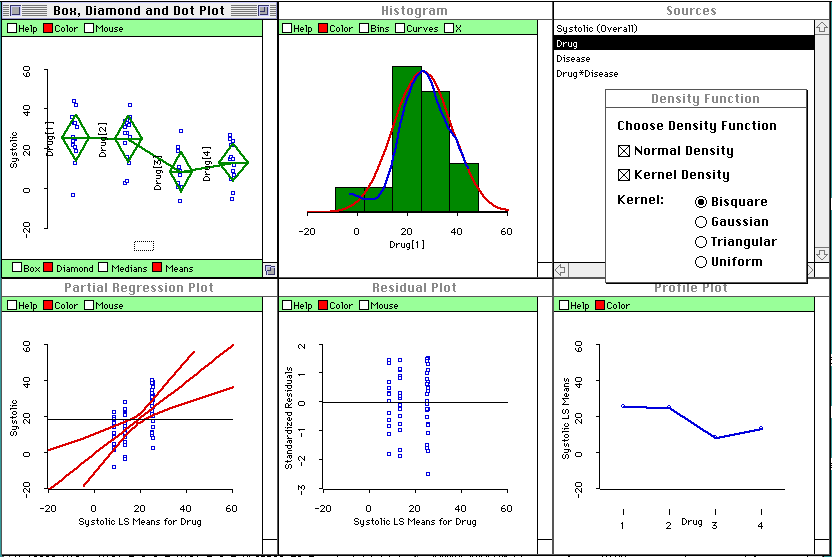
And here is the visualization.
- The diamond plot that is shown shows that drugs
1 and 2 have a greater effect on change in systolic
blood preasure than drugs 3 and 4. Other boxplots (seen
by clicking sources in the source window) show no effects
for disease or interaction.
- The partial regression plot that is shown shows
that the effect for drugs is significant at the .05
level, since the confidence envelope crosses the horizontal
line. Other partial regression plots show no effect.

Rather than show all the results here,
we turn to the ViSta Data Applet
for these data.
|